As organizations target the next level of performance, many are seeking to scale agile to the enterprise. That is, beyond the now well adopted team level and up to and including the portfolio (think c-suite). One such approach increasing in popularity is the Scaled Agile Framework (SAFe). While there are many other approaches to scale agile, for example, eSCRUM, DaD, LeSS, and RAGE, for the most part they are either similar, complement each other or can be integrated for select practices based on context. For the purpose of this post, we’ll focus on SAFe and assume you already have a basic understanding. If you need an introduction, our “Scaling Agile: SAFe and Microsoft Team Foundation Server (TFS)” recorded webinar is a good place to start. Also, we’ll assume you are a TFS using shop.
Today, from an agile enterprise and a metrics perspective, it’s not uncommon for teams to burndown hours to make sure sprints are on track and burndown points to make sure program increments (PIs) are on course. Building on these team level metrics, we also track velocity, more specifically the trend, to make sure team (s) or agile release trains (ARTs) are delivering in a predictable manner.
Yet, one of the biggest challenges with agile, scaling agile and SAFe, is appeasing management’s insatiable appetite for status reports (yes, still). In reality, management is really seeking predictability to respond to customers, provide a vision, manage dependencies, forecast revenue, growth etc. Everyone, including the agile community, recognizes these business needs.
To that end, organizations are asking themselves, “How do we measure progress?” With this question comes the desire to identify and implement new and relevant metrics. The SAFe framework offers a set of metrics at various levels (team, program and portfolio) each with a distinct purpose targeting different stakeholders. A more detailed overview can be found on the SAFe website. In general, the same or similar agile team metrics apply to SAFe as well, only maybe on a bigger scale. For certain, and regardless of your agile background, flavor or preferences, the agile community has long recognized the inherent unpredictably of software development and innovation.
"If a process is too unpredictable or too complicated for the planned, (predictive) approach, then the empirical approach (measure and adapt) is the method of choice". - Ken Schwaber
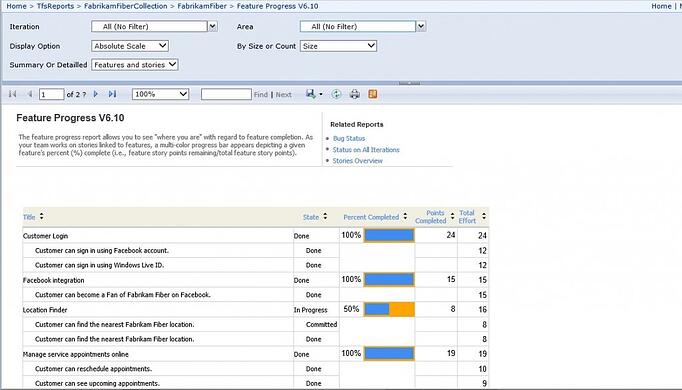
Measuring progress in SAFe is no different. And because with every sprint we gain greater perspective and more knowledge, we are increasingly in a better position to measure progress against our goals --- objectively and fact based! For example, at the program or feature level, we measure progress against what we have accepted or observed (think sprint review and system demo). Moreover, we can report against planned features and percent (%) complete. Given that TFS doesn’t provide this report OOTB, the team at InCycle developed a TFS report available to download for free to illustrate what’s possible and demonstrate how TFS can be used to support scaled agile or SAFe.
Below is a sample report we created to support our SAFe customers.
Stay tuned for more scaling agile and SAFe reporting posts. This is just the beginning.
By the way, if you didn’t already know, we offer in-house SAFe training and certification. Unlike others, we extend the traditional 2-day course and add an extra day to address advanced agile topics as well as TFS Set-up and configuration for SAFe.


